It probably won’t come as a shock that European countries dominate the list of nations with the most equitable wealth distribution. Or, to put it another way, with the lowest income inequality.
If you’re an expat who’s not fortunate enough to be a member of the Global 1 Percent, and are looking for a country with both opportunity and social stability, Europe is the place to start your search.
You want to avoid places such as Central America, where the unbreachable chasm between haves and have-nots drives crime, drug violence and corruption.
European countries such as Iceland and Norway, you’ll be relieved to know, have the narrowest gap between rich and poor, according to a new report from the Organization of Economic Cooperation and Development.
The latest report by Paris-based European economic research organization – funded by member states – finds that while it’s still a rich-get-richer world, that trend is not as pronounced among the 30 European countries in the OECD’s total 35-nation membership.
Still, OECD researchers found income inequality growing world-wide, with the incomes of the richest 10 percent equal to 10 times those of the poorest 10 percent … the biggest gap in the past 30 years.
That said, European countries dominate the list of countries with the most equitable distribution of wealth:
- Iceland
- Norway
- Denmark
- Slovenia
- Finland
- Czech Republic, or Czechia as they’ve taken to calling themselves lately
- Belgium
- Slovak Republic
- Austria
- Sweden
You have to go all the way to No. 18 before you find a non-European country, South Korea, in the OECD rankings. The United States is third from last behind Turkey, with only Mexico and Chile having worse income inequality.
The report is only 6 pages and is an interesting read if you’re into economics, with good graphics and a lot of revelations.
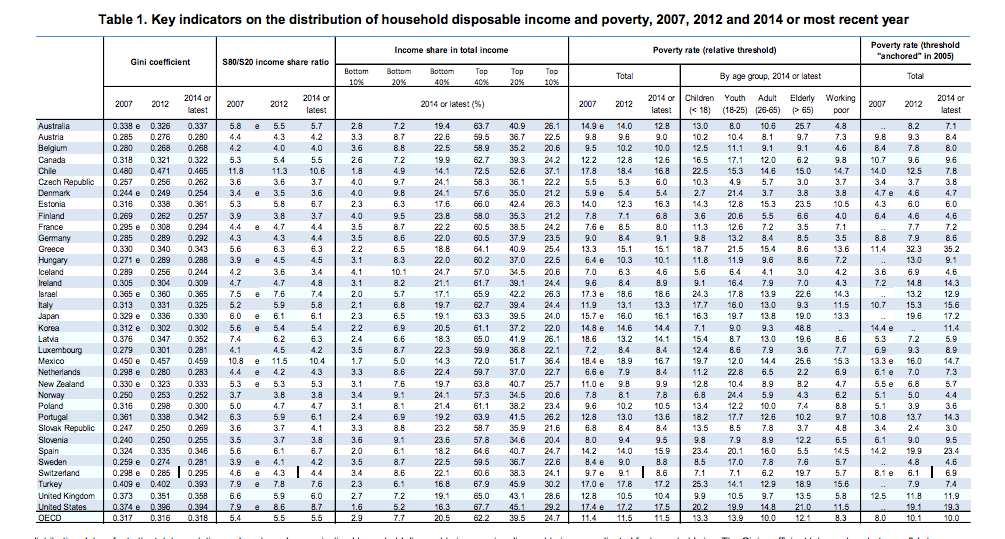
But it’s Table 1 at the end of the report that really illustrates what income inequality looks like. The chart divides national income share into the bottom and top 10 percent, 20 percent and 40 percent.
If you look at the countries closest to having equitable distribution of household disposable income such as Iceland, the top 20 percent of citizens have 30 percent of the wealth while the bottom 20 percent have about 10 percent.
If you look at the countries with the most inequitable income distributions such as the U.S., the top 20 percent have 40 percent or more of household disposable incomes, and the bottom 10 percent as little as 1.6 percent!
Now THAT’S inequality.
How European countries rank on OECD list might come as a surprise, with the larger economies suffering the most as decreasing post-Recesssion unemployment doesn’t necessarily lead to increasing wages.
Using the OECD coefficient, since 2007, inequality has increased in Great Britain, Slovak Republic, Spain and Sweden, but fallen in Iceland and Latvia.
There is a deeper, more complex macro-economic trend that has hurt the lower income strata in countries such as Greece, Spain, Portugal and the UK, according to the report. Essentially, the world as a whole is still dealing with the fallout from the Great Recession.
For instance, according to the report, post-Recession joblessness has declined in Great Britain. BUT, real wages have fallen, hurting the average worker … which to some extent explains the Brexit vote.
Moreover, austerity programs in Portugal, Greece and Spain have included wage freezes and new economic policies that limited social programs such as unemployment benefits.
This is a quick-read report that will leave you thinking, “Wow, this explains a lot ….”